Thermodynamic Database
Components (37)
Total of 37 components are included in the database as listed here:
Ag, Al, Au, B, Be, Bi, C, Co, Cr, Cu, Fe, Ge, In, Ir, Mg, Mn, Mo, Nb, Ni, O, Os, P, Pb, Pd, Pt, Re, Rh, Ru, S, Sb, Se, Si, Sn, Ti, V, Zn and Zr
Suggested Applicable Alloy Systems
The current PanNoble database can be used for several series of alloys:
(a) Noble metal alloys:
-
Silver alloys with major alloying elements of Cu, Ni, Sn, Zn, Sn, and Ge
-
Gold alloys with alloying elements of Ag, Cu, Pd, Pt, Al, Fe, Ni, and Zn
-
Platinum group metals (Ru, Rh, Pd, Os, Ir, Pt) and their alloys
(b) Wrought (C10100-C79999) and Cast (C80000-C96999) Copper alloys:
-
Coppers (C10100-C15999 and C80000-C81399) with majority Cu >99.95% and small amount of trace elements, such as Ni, S, Se, Sn, etc.
-
High-copper alloys (C16000-C19999 and C81400-83299) with major alloying elements of Be, Cr, Ni, Si, Sn, and minor elements Ag, Al, Co, Fe, Pb, P, Zr, etc.
-
Brasses (C20000-C49999 and C83300-C89999)) with major alloying elements of Pb, Sn, Zn and other minor elements Al, As, Bi, Fe, Ni, P, Sb, Se, Si, etc.
-
Bronzes (C50000-C69999 and C90000-C95999) with major alloying elements of Ni, Sn and minor elements Al, Fe, Mn, P, Pb, Sb, Si, etc.
-
Copper-Nickel alloys (C70000-C79999 and C96000-C96999) with major alloying elements of Fe, Ni, Zn and minor alloying elements Be, C, Mn, Nb, Pb, Si, Sn, etc.
-
Copper-Lead alloys (C98000-C98999) with major alloying elements of Pb and minor elements Ag, Fe, Ni, P, Sn, Sn, Zn, etc.
-
Copper-Nickel-Aluminum special alloys (C99000-C99999) with major alloying elements of Al, Fe, Ni and minor elements Co, Mn, Pb, Si, Sn, etc.
(c) Solder alloys:
-
Commercial Pb/Sn-base micro-soldering alloy system with major alloying elements of Ag, Al, Au, Bi, Cu, In, Ni, Sb, Zn, etc.
(d) Pd-Sb-based lead-acid battery grid alloys with major alloying elements of Sb and minor elements As, Cu, Se, Sn, etc.
(e) High-entropy alloys of the Al-Co-Cr-Cu-Fe-Mn-Ni system with the addition of other minor elements in this database
The suggested composition range for each element is listed in Table 1. It should be noted that this given composition range is rather conservative. It is derived from the chemistries of the multicomponent commercial alloys that have been used to validate the current database. In the subsystems, many of these elements can be applied to a much wider composition range. In fact, some subsystems are valid in the entire composition range as given in Section Assessed Subsystems.
Phases
Total of 949 phases are included in the database and a few key phases are listed in Table 2. Information on all the other phases is listed in PanNoble2025: List of Phases. Users can also view it through TDB viewer of Pandat.
Assessed Subsystems
A total of 626 subsystems, including 458 binary and 168 ternary subsystems have been assessed. The modeling status is indicated by numbers. The systems with number 10 are fully assessed in the whole composition range. The higher value shows higher reliability of the system.
Binary Systems (458)
| Ag-Al(10) | Ag-Au(10) | Ag-B(10) | Ag-Bi(10) | Ag-C(10) | Ag-Co(10) | Ag-Cr(10) |
| Ag-Cu(10) | Ag-Fe(10) | Ag-Ge(10) | Ag-In(10) | Ag-Ir(10) | Ag-Mg(10) | Ag-Mn(10) |
| Ag-Mo(10) | Ag-Ni(10) | Ag-O(5) | Ag-Os(10) | Ag-Pb(10) | Ag-Pd(10) | Ag-Pt(10) |
| Ag-Re(10) | Ag-Rh(10) | Ag-Ru(10) | Ag-Sb(10) | Ag-Si(10) | Ag-Sn(10) | Ag-Ti(10) |
| Ag-V(10) | Ag-Zn(10) | Ag-Zr(10) | Al-Au(10) | Al-B(10) | Al-Be(10) | Al-Bi(10) |
| Al-C(10) | Al-Co(10) | Al-Cr(10) | Al-Cu(10) | Al-Fe(10) | Al-Ge(10) | Al-In(10) |
| Al-Ir(10) | Al-Mg(10) | Al-Mn(10) | Al-Mo(10) | Al-Nb(10) | Al-Ni(10) | Al-O(10) |
| Al-Os(10) | Al-P(10) | Al-Pb(10) | Al-Pd(10) | Al-Pt(10) | Al-Re(10) | Al-Ru(10) |
| Al-Sb(10) | Al-Se(10) | Al-Si(10) | Al-Sn(10) | Al-Ti(10) | Al-V(10) | Al-Zn(10) |
| Al-Zr(10) | Au-B(10) | Au-Bi(10) | Au-C(10) | Au-Co(10) | Au-Cr(10) | Au-Cu(10) |
| Au-Fe(10) | Au-Ge(10) | Au-In(10) | Au-Ir(5) | Au-Mn(10) | Au-Ni(10) | Au-O(5) |
| Au-Os(10) | Au-Pb(10) | Au-Pd(10) | Au-Pt(10) | Au-Re(10) | Au-Rh(10) | Au-Ru(10) |
| Au-Sb(10) | Au-Se(10) | Au-Si(10) | Au-Sn(10) | Au-Ti(10) | Au-Zn(10) | Au-Zr(10) |
| B-C(10) | B-Co(10) | B-Cr(10) | B-Cu(10) | B-Fe(10) | B-Ge(10) | B-Ni(10) |
| B-O(10) | B-P(5) | B-Pb(10) | B-Pt(10) | B-Re(10) | B-Sb(10) | B-Se(10) |
| B-Si(10) | B-Sn(10) | B-Ti(10) | B-Zn(10) | B-Zr(10) | Be-Co(10) | Be-Cu(10) |
| Be-Ni(10) | Be-O(10) | Be-Si(10) | Bi-Co(10) | Bi-Cr(10) | Bi-Cu(10) | Bi-Fe(10) |
| Bi-Ge(10) | Bi-In(10) | Bi-Mg(10) | Bi-Mn(10) | Bi-Ni(10) | Bi-O(10) | Bi-Os(10) |
| Bi-P(10) | Bi-Pb(10) | Bi-Pd(10) | Bi-S(5) | Bi-Sb(10) | Bi-Se(10) | Bi-Si(10) |
| Bi-Sn(10) | Bi-Ti(10) | Bi-Zn(10) | C-Co(10) | C-Cr(10) | C-Cu(5) | C-Fe(10) |
| C-Ge(10) | C-Ir(10) | C-Mg(10) | C-Mn(10) | C-Mo(10) | C-Nb(10) | C-Ni(10) |
| C-O(10) | C-P(10) | C-Pd(10) | C-Pt(10) | C-Re(10) | C-Rh(10) | C-Ru(10) |
| C-Si(10) | C-Sn(10) | C-Ti(10) | C-V(10) | C-Zn(10) | C-Zr(10) | Co-Cr(10) |
| Co-Cu(10) | Co-Fe(10) | Co-Ge(10) | Co-In(10) | Co-Ir(10) | Co-Mn(10) | Co-Mo(10) |
| Co-Nb(10) | Co-Ni(10) | Co-O(10) | Co-Os(5) | Co-P(8) | Co-Pb(10) | Co-Pd(10) |
| Co-Pt(10) | Co-Re(10) | Co-Rh(10) | Co-Ru(10) | Co-Sb(10) | Co-Si(10) | Co-Sn(10) |
| Co-Ti(10) | Co-V(10) | Co-Zn(10) | Co-Zr(10) | Cr-Cu(10) | Cr-Fe(10) | Cr-Ge(10) |
| Cr-In(10) | Cr-Ir(10) | Cr-Mn(10) | Cr-Mo(10) | Cr-Nb(10) | Cr-Ni(10) | Cr-O(10) |
| Cr-Os(10) | Cr-P(5) | Cr-Pb(10) | Cr-Pd(10) | Cr-Pt(10) | Cr-Re(10) | Cr-Rh(10) |
| Cr-Ru(10) | Cr-S(5) | Cr-Sb(10) | Cr-Se(10) | Cr-Si(10) | Cr-Sn(10) | Cr-Ti(10) |
| Cr-V(10) | Cr-Zn(10) | Cr-Zr(10) | Cu-Fe(10) | Cu-Ge(10) | Cu-In(10) | Cu-Ir(10) |
| Cu-Mg(10) | Cu-Mn(10) | Cu-Mo(10) | Cu-Nb(10) | Cu-Ni(10) | Cu-O(10) | Cu-Os(10) |
| Cu-P(5) | Cu-Pb(10) | Cu-Pd(10) | Cu-Pt(10) | Cu-Re(10) | Cu-Rh(10) | Cu-Ru(10) |
| Cu-S(10) | Cu-Sb(10) | Cu-Se(10) | Cu-Si(10) | Cu-Sn(10) | Cu-Ti(10) | Cu-V(10) |
| Cu-Zn(10) | Cu-Zr(10) | Fe-In(10) | Fe-Ir(10) | Fe-Mg(10) | Fe-Mn(10) | Fe-Mo(10) |
| Fe-Nb(10) | Fe-Ni(10) | Fe-O(10) | Fe-Os(10) | Fe-P(5) | Fe-Pb(10) | Fe-Pd(10) |
| Fe-Pt(10) | Fe-Re(10) | Fe-Rh(10) | Fe-Ru(10) | Fe-S(10) | Fe-Sb(10) | Fe-Se(5) |
| Fe-Si(10) | Fe-Sn(10) | Fe-Ti(10) | Fe-V(10) | Fe-Zn(10) | Fe-Zr(10) | Ge-In(10) |
| Ge-Mg(10) | Ge-Mn(10) | Ge-Mo(10) | Ge-Nb(10) | Ge-Ni(10) | Ge-O(10) | Ge-P(10) |
| Ge-Pb(10) | Ge-Pd(10) | Ge-Pt(10) | Ge-Ru(10) | Ge-Sb(10) | Ge-Si(10) | Ge-Sn(10) |
| Ge-Ti(10) | Ge-V(10) | Ge-Zn(10) | In-Ir(10) | In-Ni(10) | In-O(10) | In-P(5) |
| In-Pb(10) | In-Pd(10) | In-Pt(10) | In-Sb(10) | In-Si(10) | In-Sn(10) | In-V(10) |
| In-Zn(10) | Ir-Ni(10) | Ir-O(10) | Ir-Os(5) | Ir-Pd(10) | Ir-Pt(10) | Ir-Re(10) |
| Ir-Rh(10) | Ir-Ru(10) | Ir-Zr(10) | Mg-Mn(10) | Mg-Ni(10) | Mg-O(10) | Mg-Ru(10) |
| Mg-Sb(10) | Mg-Si(10) | Mg-Sn(10) | Mg-Ti(10) | Mg-Zn(10) | Mg-Zr(10) | Mn-Mo(10) |
| Mn-Nb(10) | Mn-Ni(10) | Mn-O(10) | Mn-Os(10) | Mn-P(10) | Mn-Pb(10) | Mn-Pd(10) |
| Mn-Pt(10) | Mn-Re(10) | Mn-Rh(10) | Mn-Ru(10) | Mn-S(10) | Mn-Se(10) | Mn-Si(10) |
| Mn-Sn(10) | Mn-Ti(10) | Mn-V(10) | Mn-Zn(10) | Mn-Zr(10) | Mo-Nb(10) | Mo-Ni(10) |
| Mo-O(10) | Mo-Pd(10) | Mo-Pt(10) | Mo-Re(10) | Mo-Ru(10) | Mo-Si(10) | Mo-Sn(10) |
| Mo-Ti(10) | Mo-V(10) | Mo-Zr(10) | Nb-O(10) | Nb-Pt(10) | Nb-Re(10) | Nb-Si(10) |
| Nb-Sn(10) | Nb-Ti(10) | Nb-V(10) | Nb-Zr(10) | Ni-O(10) | Ni-Os(10) | Ni-P(10) |
| Ni-Pb(10) | Ni-Pd(10) | Ni-Pt(10) | Ni-Re(10) | Ni-Rh(10) | Ni-Ru(10) | Ni-S(10) |
| Ni-Sb(5) | Ni-Se(10) | Ni-Si(10) | Ni-Sn(10) | Ni-Ti(10) | Ni-V(10) | Ni-Zn(10) |
| Ni-Zr(10) | O-Os(5) | O-P(10) | O-Pb(10) | O-Pd(5) | O-Re(5) | O-Rh(5) |
| O-Ru(5) | O-S(10) | O-Sb(7) | O-Se(5) | O-Si(10) | O-Sn(10) | O-Ti(10) |
| O-V(10) | O-Zn(5) | O-Zr(10) | Os-Pd(10) | Os-Pt(10) | Os-Re(10) | Os-Rh(10) |
| Os-Ru(10) | Os-Si(10) | P-Si(5) | P-Sn(5) | P-Zn(5) | Pb-Pd(10) | Pb-Pt(10) |
| Pb-Re(10) | Pb-Rh(10) | Pb-Ru(10) | Pb-S(10) | Pb-Sb(10) | Pb-Se(10) | Pb-Si(10) |
| Pb-Sn(10) | Pb-Ti(10) | Pb-Zn(10) | Pd-Pt(10) | Pd-S(8) | Pd-Sb(5) | Pd-Se(10) |
| Pd-Si(10) | Pd-Sn(10) | Pd-Zn(10) | Pd-Zr(10) | Pt-Re(10) | Pt-Rh(10) | Pt-Ru(10) |
| Pt-Sb(10) | Pt-Si(10) | Pt-Sn(10) | Pt-Ti(10) | Pt-V(10) | Pt-Zr(10) | Re-Rh(10) |
| Re-Si(10) | Re-Ti(10) | Re-Zr(10) | Rh-Ru(10) | Ru-Si(10) | Ru-Ti(10) | Ru-Zr(10) |
| S-Zn(10) | Sb-Se(10) | Sb-Si(10) | Sb-Sn(10) | Sb-Ti(10) | Sb-Zn(10) | Se-Si(10) |
| Se-Sn(10) | Se-Zn(10) | Si-Sn(10) | Si-Ti(10) | Si-V(10) | Si-Zn(10) | Si-Zr(10) |
| Sn-Ti(10) | Sn-V(10) | Sn-Zn(10) | Sn-Zr(10) | Ti-V(10) | Ti-Zn(10) | Ti-Zr(10) |
| V-Zn(10) | V-Zr(10) | Zn-Zr(10) |
Ternary Systems (168)
| Ag-Al-Au(10) | Ag-Al-Cu(10) | Ag-Al-Ge(10) | Ag-Al-Si(10) | Ag-Al-Sn(10) | Ag-Al-Zn(10) |
| Ag-Au-Bi(10) | Ag-Au-Cu(10) | Ag-Au-Ge(10) | Ag-Au-Pb(10) | Ag-Au-Si(10) | Ag-Au-Sn(10) |
| Ag-Bi-Cu(10) | Ag-Bi-In(10) | Ag-Bi-Pb(10) | Ag-Bi-Sb(10) | Ag-Bi-Sn(10) | Ag-Bi-Zn(10) |
| Ag-Cu-In(10) | Ag-Cu-Ni(10) | Ag-Cu-Pb(10) | Ag-Cu-Sn(10) | Ag-Cu-Zn(10) | Ag-In-Pd(10) |
| Ag-In-Sb(10) | Ag-In-Sn(10) | Ag-Pb-Sb(10) | Ag-Pb-Sn(10) | Ag-Sb-Sn(10) | Ag-Sn-Zn(10) |
| Al-Bi-Cu(10) | Al-Bi-Zn(10) | Al-C-Co(10) | Al-C-Mn(10) | Al-C-Ni(10) | Al-Co-Cr(10) |
| Al-Co-Cu(10) | Al-Co-Fe(10) | Al-Co-Mn(10) | Al-Co-Ni(10) | Al-Cr-Cu(10) | Al-Cr-Fe(10) |
| Al-Cr-Ni(10) | Al-Cu-Fe(10) | Al-Cu-Mn(10) | Al-Cu-Ni(10) | Al-Cu-Sb(10) | Al-Cu-Si(10) |
| Al-Cu-Sn(10) | Al-Cu-Zn(10) | Al-Fe-Mn(10) | Al-Fe-Ni(10) | Al-Fe-Si(10) | Al-Fe-Zn(10) |
| Al-In-Sb(10) | Al-In-Sn(10) | Al-Mn-Ni(10) | Al-Pb-Zn(10) | Al-Si-Sn(10) | Al-Si-Zn(10) |
| Al-Sn-Zn(10) | Au-Ge-Sb(10) | Au-Ge-Sn(10) | Au-In-Sb(10) | Au-In-Sn(10) | Au-Ni-Sn(10) |
| Au-Pt-Re(10) | Au-Sb-Si(10) | Au-Si-Sn(10) | B-Co-Fe(10) | B-Cu-Fe(10) | B-Fe-Ni(10) |
| B-Ni-Si(10) | Bi-Cu-Ni(10) | Bi-Cu-Pb(10) | Bi-Cu-Sb(10) | Bi-Cu-Se(10) | Bi-Cu-Sn(10) |
| Bi-Cu-Zn(10) | Bi-In-Pb(10) | Bi-In-Sb(10) | Bi-In-Sn(10) | Bi-Sb-Sn(10) | Bi-Sb-Zn(10) |
| Bi-Se-Sn(10) | Bi-Se-Zn(10) | Bi-Sn-Zn(10) | C-Co-Fe(10) | C-Co-Ni(10) | C-Cr-Fe(10) |
| C-Cu-Fe(10) | C-Fe-Ni(10) | Co-Cr-Cu(10) | Co-Cr-Fe(10) | Co-Cr-Ni(10) | Co-Cu-Fe(10) |
| Co-Cu-Mn(10) | Co-Cu-Ni(10) | Co-Fe-Pd(10) | Co-Fe-Re(10) | Co-Mn-Ni(10) | Co-Mn-Pd(10) |
| Co-Ni-P(6) | Co-Ni-Re(10) | Cr-Cu-Fe(10) | Cr-Cu-Mn(10) | Cr-Cu-Ni(10) | Cr-Cu-Si(10) |
| Cr-Cu-Sn(10) | Cr-Cu-Ti(10) | Cr-Fe-Mn(10) | Cr-Fe-Ni(10) | Cr-Fe-P(10) | Cr-Fe-S(10) |
| Cr-Fe-Si(10) | Cr-Mn-Ni(10) | Cr-Mn-S(10) | Cr-Ni-Pd(10) | Cr-Ni-S(10) | Cr-Ni-Si(10) |
| Cu-Fe-Mn(10) | Cu-Fe-Ni(10) | Cu-Fe-P(10) | Cu-Fe-S(10) | Cu-Fe-Sb(10) | Cu-Fe-Si(10) |
| Cu-Fe-Zn(10) | Cu-In-Sn(10) | Cu-Mn-Ni(10) | Cu-Mn-Zn(10) | Cu-Ni-P(10) | Cu-Ni-Pb(10) |
| Cu-Ni-Sb(10) | Cu-Ni-Si(10) | Cu-Ni-Sn(10) | Cu-Ni-Ti(10) | Cu-Ni-Zn(10) | Cu-P-Sn(10) |
| Cu-Pb-S(10) | Cu-Pb-Sb(10) | Cu-Pb-Zn(10) | Cu-Sb-Se(10) | Cu-Sb-Sn(10) | Cu-Sb-Zn(10) |
| Cu-Se-Zn(10) | Cu-Si-Ti(10) | Cu-Si-Zn(10) | Cu-Sn-Ti(10) | Cu-Sn-Zn(10) | Cu-Ti-Zn(10) |
| Fe-Mn-Ni(10) | Fe-Mn-S(10) | Fe-Mn-Si(10) | Fe-Ni-Pd(10) | Fe-Ni-Re(10) | Fe-Ni-S(10) |
| Fe-Ni-Si(10) | Fe-Si-Sn(10) | In-Pb-Zn(10) | In-Sb-Sn(10) | In-Sn-Zn(10) | Mn-Ni-S(10) |
| Ni-Si-Ti(10) | Ni-Si-Zn(10) | Ni-Sn-Zn(10) | Pb-Sb-Sn(10) | Pb-Sb-Zn(10) | Pd-Rh-Ru(10) |
Database Validation
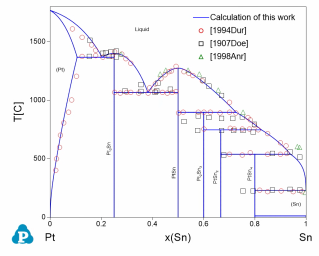
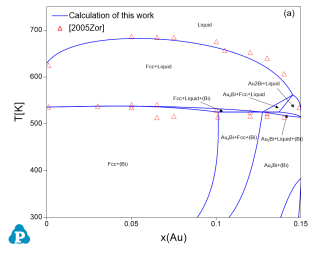
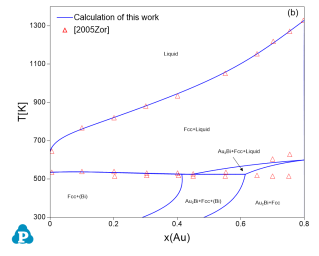
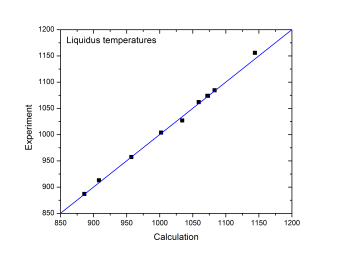
The current thermodynamic database can be used to calculate the phase diagrams not only for the noble-metal-rich systems (Ag-, Au-, Cu-, Ir-, Pd- and Pt-) but also other common alloying systems, such as Pb and/or Sn-rich solders. Extensive tests and validations have been carried out on the current thermodynamic database using the published experimental data in the literature. A few examples are given below. Figure 1 shows the Pt-Sn binary phase diagram with experimental phase boundary data plotted on it. Figure 2 shows two isoplethal sections in the of the Ag-Au-Bi ternary system: (a) Ag-Au-85 at.%Bi; (b) Au-Bi-20 at.%Ag. The experimentally measured phase boundary data are also plotted on them for comparison. Figure 3 shows comparison between the calculated and measured liquidus temperatures for some Cu-rich alloys.
Figure 2: Comparison between the calculated isopleths and experimentally measured data of the Ag-Au-Bi ternary system (a) Ag-Au-85 at.%Bi; (b) Au-Bi-20 at.%Ag
Figure 3: Comparison between the calculated and experimentally measured liquidus temperatures of [1982Bac]
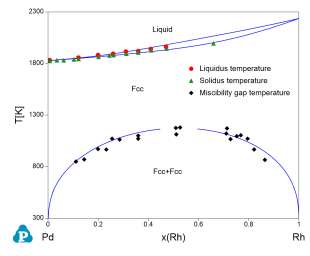
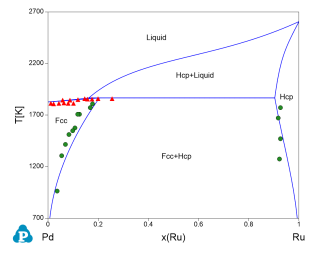
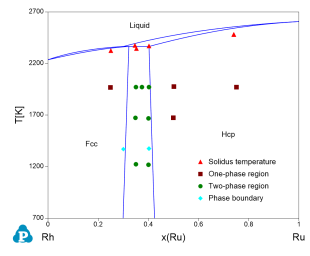
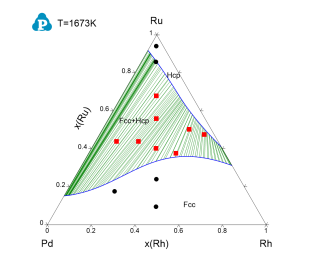
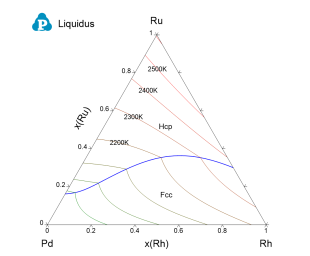
Figure 4 toFigure 8 show the calculated constituent binary phase diagrams, isothermal section and liquidus projection of the Pd-Rh-Ru ternary system.
[1907Doe] F. Doerinckel, Z. Anorg. Chem., 54 (1907): 333–366.
[1982Bac] L. Bäckerud, L.M. Liljenvall, H. Steen, “Solidification characteristics of some copper alloys”, International Copper Research Association, Inc., New York, 1982.
[1984Rae] M.V.RaevskayaV.V.VasekinI.G.Sokolova, Journal of the Less Common Metals, 99(1) (1984): 137-142.
[1994Dur] Ph. Durussel, R. Massara, P. Feschotte, J. Alloy Compd., 215 (1994): 175–179.
[1998Anr] P. Anres, M. Gaune-Escard, J.P. Bros, E. Hayer, J. Alloys Compd., 280 (1998): 158–167.
[2016Gos] S. Gosse, N. Dupin, C. Gueneau, J.C. Crivello, J.M. Joubert, Jounrla of Nuclear Materials, 474 (2016): 163-173.
